Workplace Demographics at UE
United Educators (UE) voluntarily publishes workforce demographic data as one part of our commitment to diversity, equity, inclusion, and belonging (DEI&B). Transparency about our workplace helps us and our membership consider how we can foster a more equitable environment.
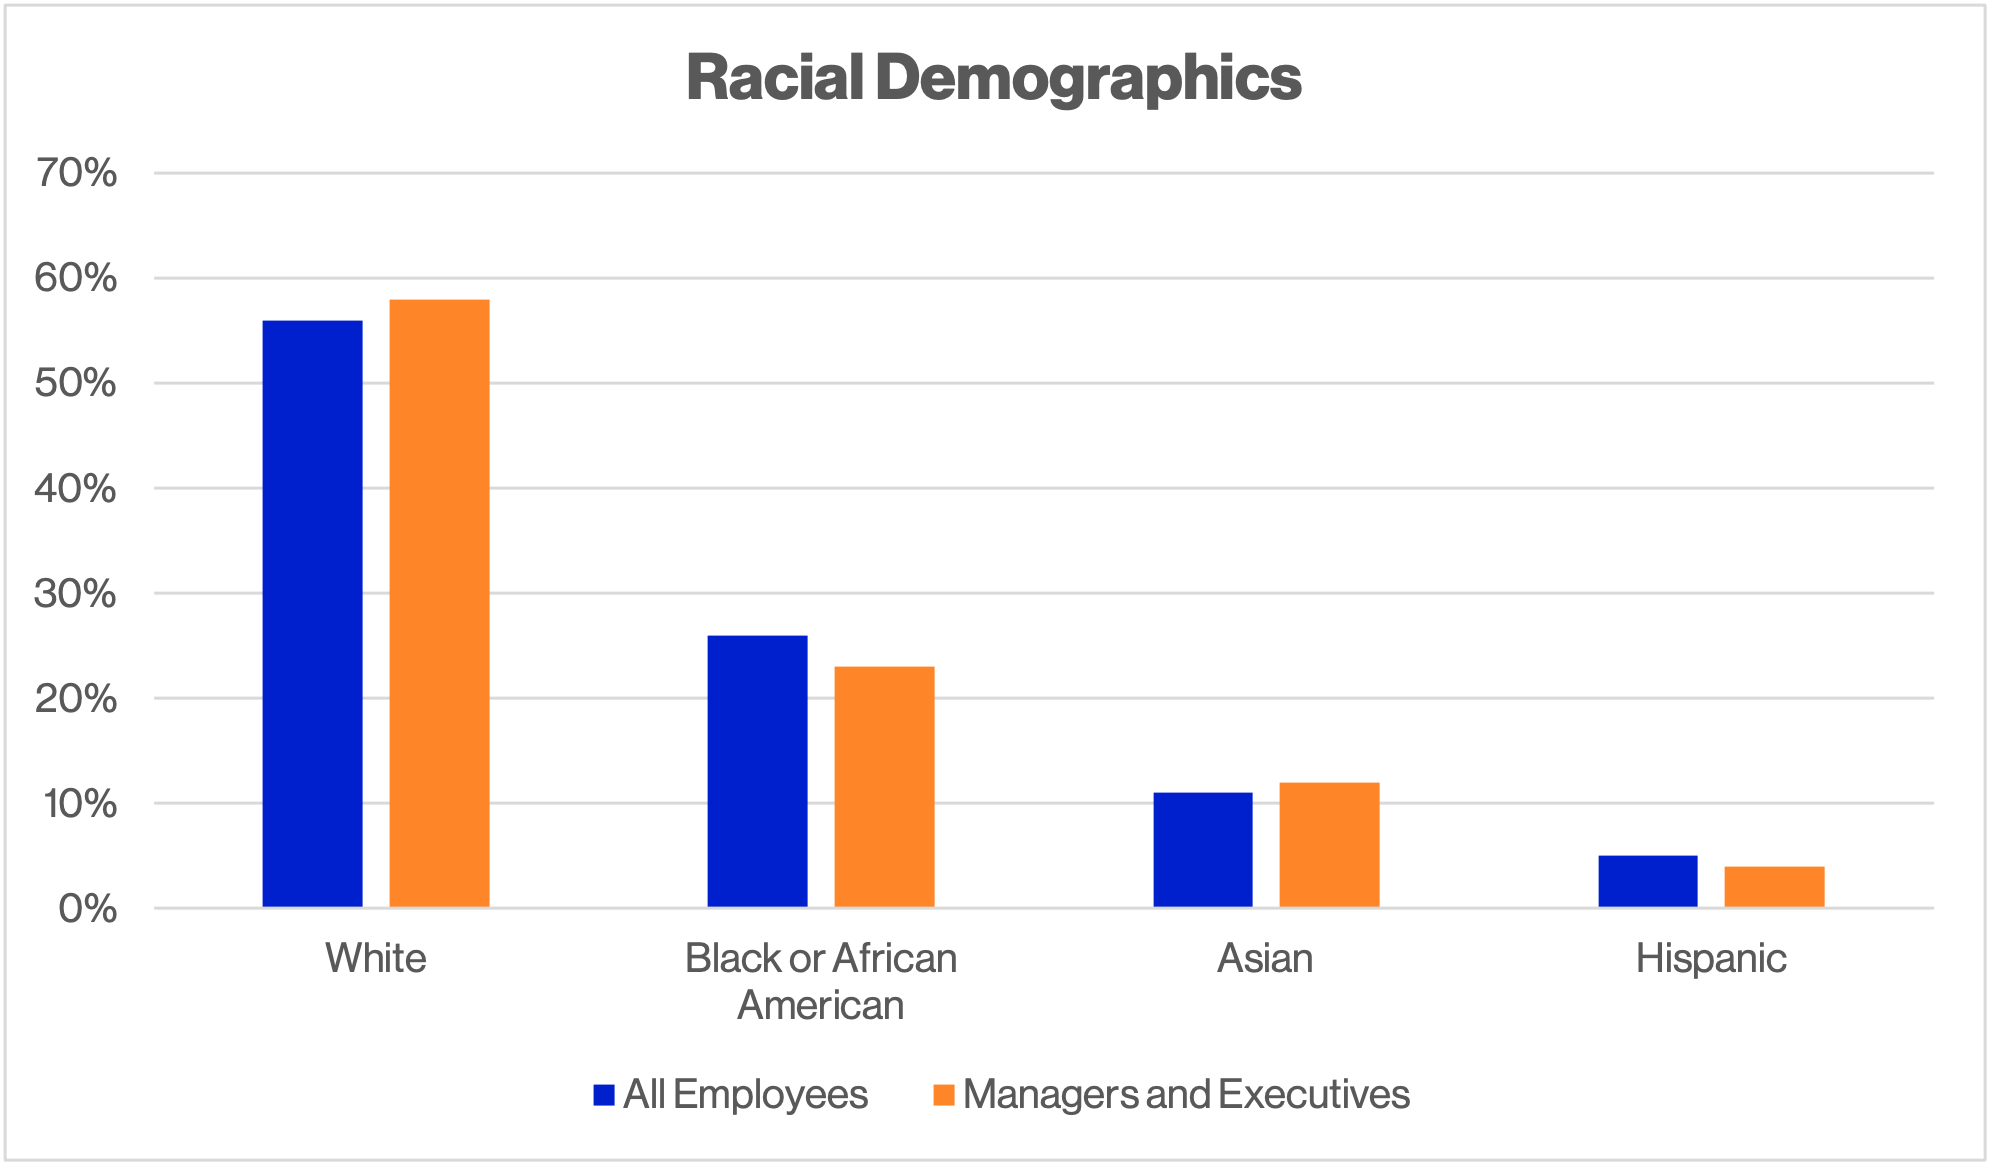
Demographic Breakdowns of UE Workforce and Managers1
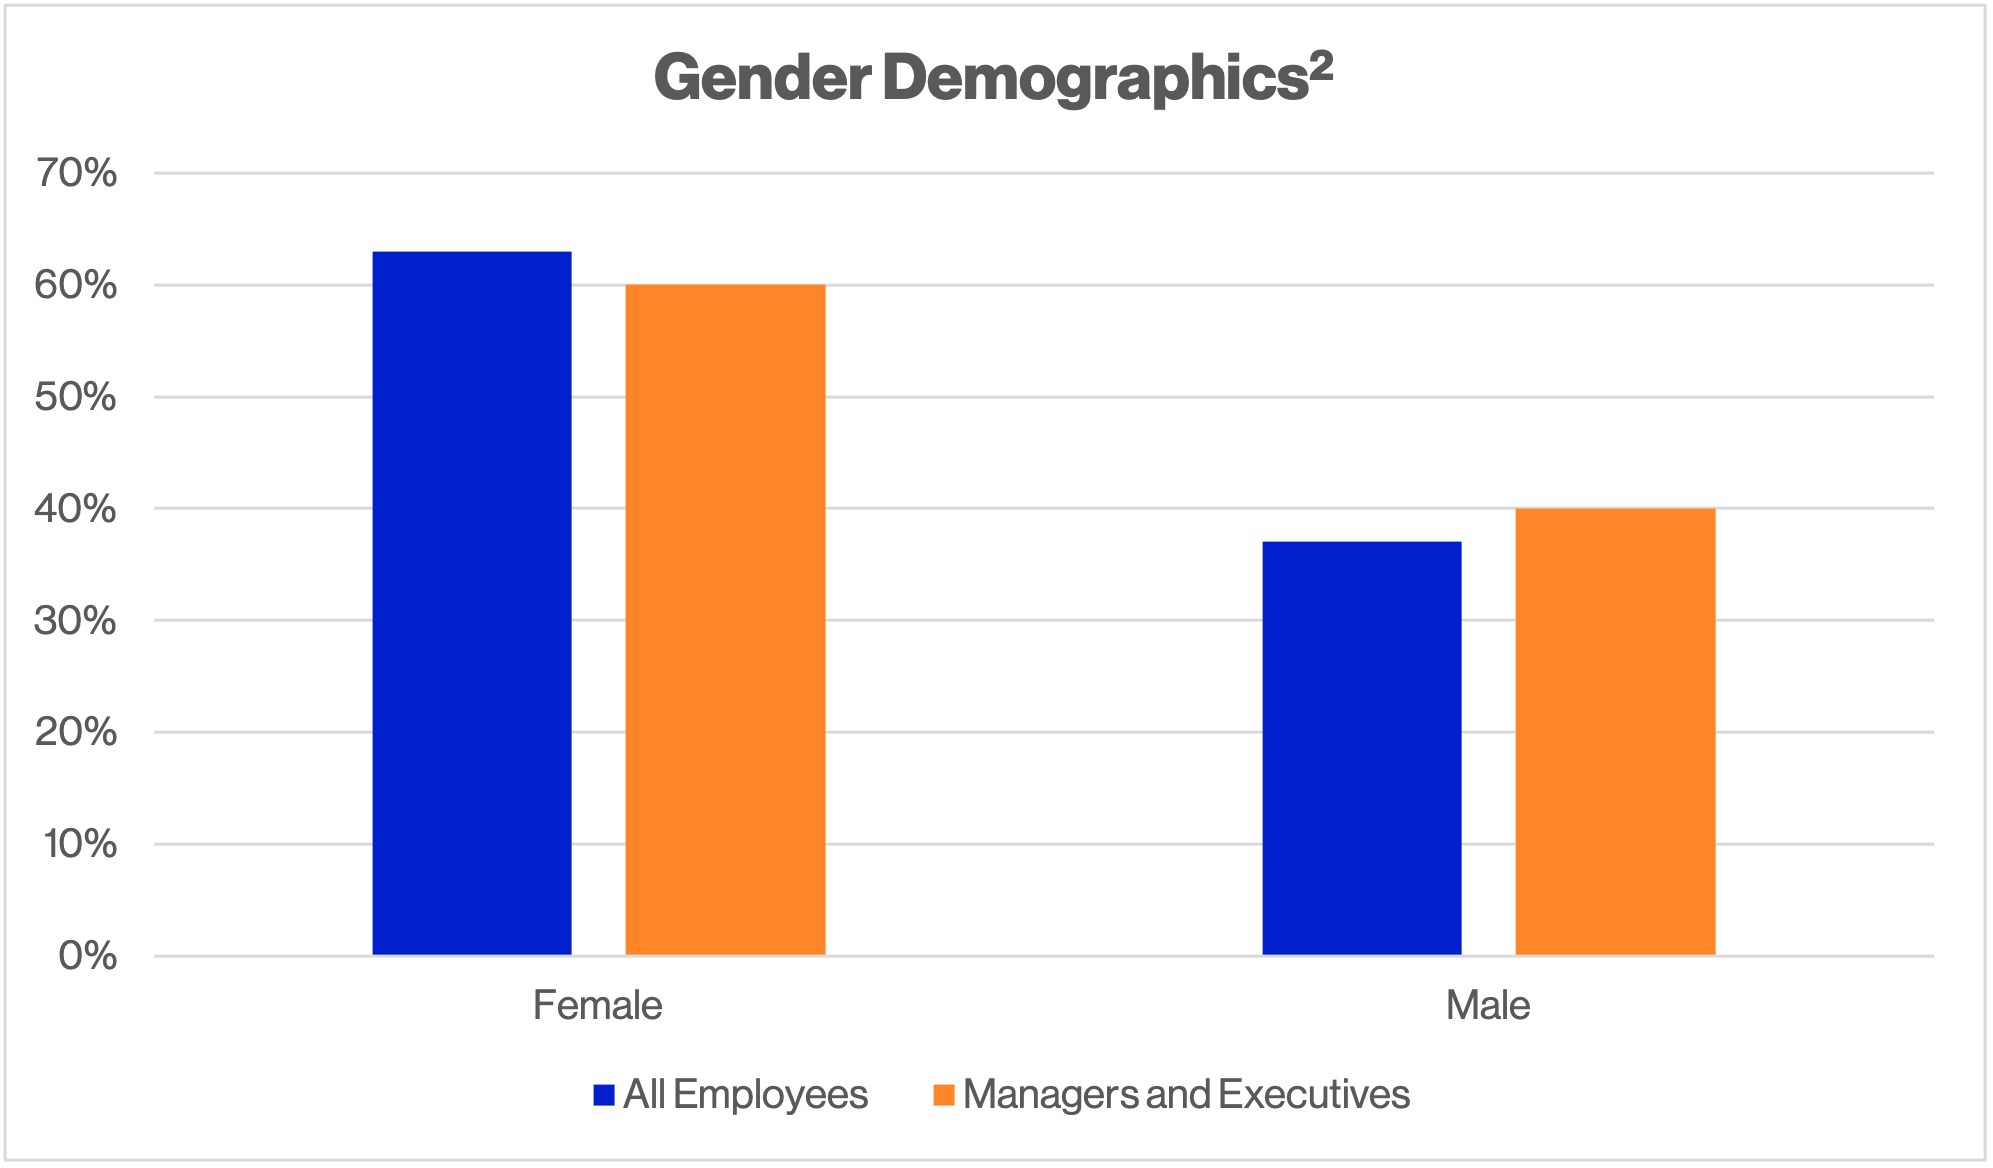
Our talent management philosophy includes a commitment to attract, develop, and retain the best people. We offer employees of all backgrounds career development and promotion opportunities. Race and gender demographics of managers and leaders closely align with those of the entire UE workforce.

1UE data as self-reported to the Equal Employment Opportunity Commission. This excludes employees that did not provide racial or gender identity data. Employees identifying as Native Hawaiian or Other Pacific Islander or two or more races are not reported here due to small sample size.
2According to the Bureau of Labor Statistics, 60% of the insurance industry workforce in the United States identifies as female. Employees with non-binary gender identities are not reported here due to small sample size.
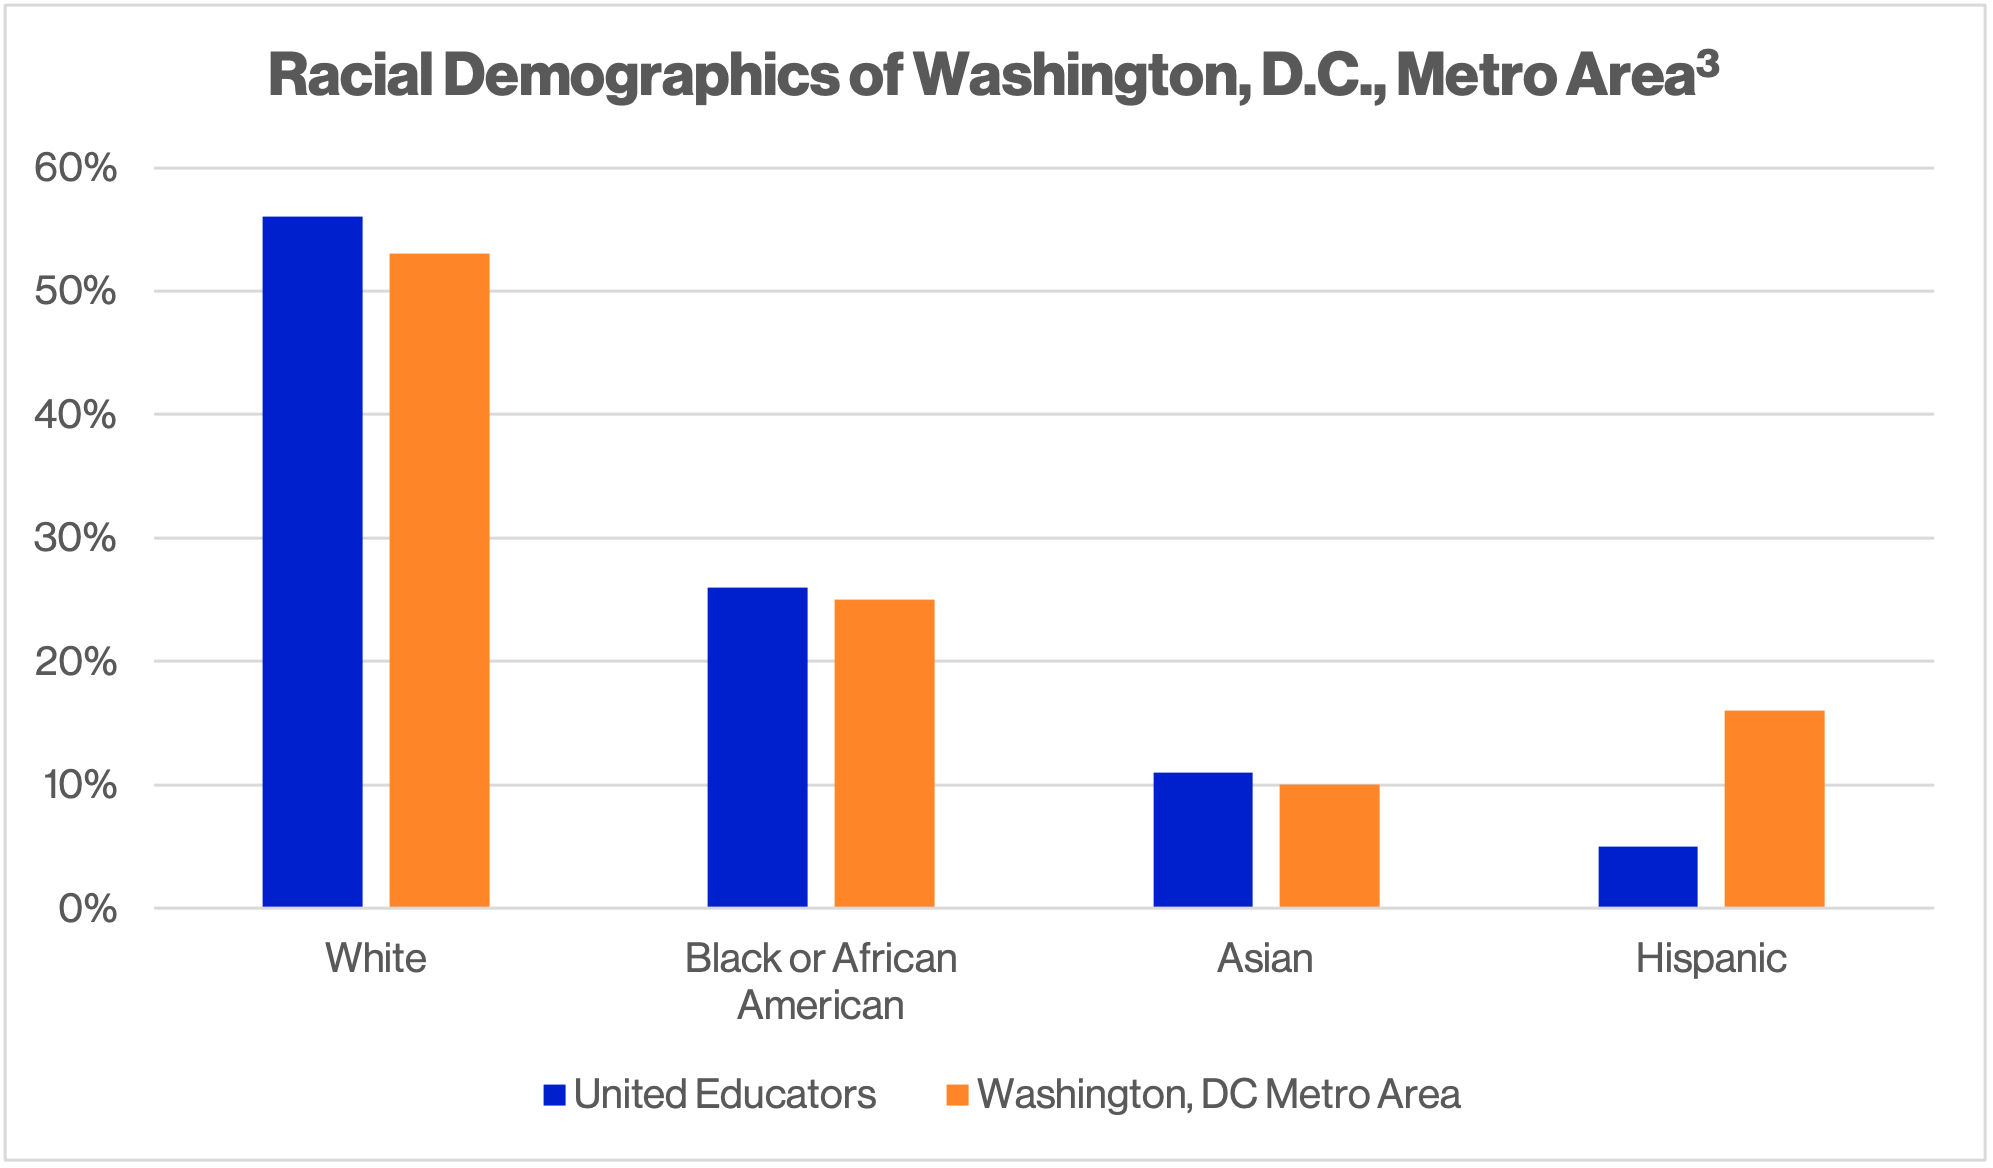
Racial Breakdown of UE Compared to the Washington, D.C., Metro Area
For the most part, our workforce’s racial demographics reflect our local and diverse Washington, D.C., metro area.

3Washington, D.C., Metropolitan Statistical Area demographic data from the 2019 American Community Survey.
Learn more about UE's DEI&B initiatives.
For more information about our Inclusion, Diversity, and Equity Alliance (IDEA), please contact info@ue.org.
Join Our Team
Interested in working for a diverse, education-specific insurance carrier? Learn more about careers at UE.


